

Data Interpretation is the calculation demanding portion of the section. It consists of a numerous of graphs, charts and tables from which you will have to pick up and analyze data. Here we are providing 5 Tricks To Crack Data Interpretation in CAT Exam.

In this section candidates have to identify important key points in the graph or table to answer the multiple questions. Aspirants have to read the graph carefully and note that important key points to put answer quickly.
Data Interpretation (DI) and Logical Reasoning (LR) becoming a separate section in CAT 2015. it should note that that CAT aspirants not only clear the sectional cut-off in this section, but also score to the utmost, that may equalize any possible decrease in marks in other two sections.
One of the famous Author Nishit Kumar Sinha , Pearson’s Author has explained some points to solve DI section.
5 Tricks To Crack Data Interpretation
- Generating familiarity with different sets of data presentation techniques:
Candidates should get aware of different types of data techniques like types of pictorial charts, table, bar chart, pie chart and line charts. In previous cat exam the questions are also asked from Scatter diagram and Radar diagrams too.
2. Percentage and Ratio applications:
These above said two chapters from Quantitative Aptitude are very important in DI calculation. There are three different methods of ratio comparison as given below:
Method i: Cross Multiplication method

Method ii: Decimal Calculation:

- Approximation techniques:
Before a candidate starts calculating the final answer, he should look the option from A first. Some answers might not be too close as in that case approximation might lead us to choose the wrong option as the answer. So, be care while attempting the approximate type of questions.
4. Calculation Techniques specific to the data sets: The example of this topic is given with graph check it.
Following figure shows the sales figure of due North Inc. for the year 2007-08 and 08-09. It is also given that share of North India in total sales figure is 20% and 24% in respective years.

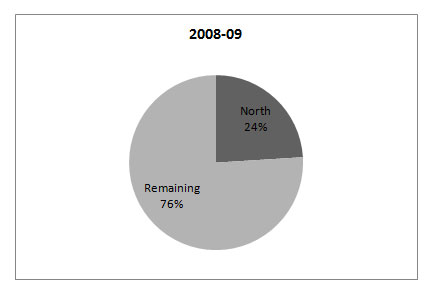
Question: What is the percentage growth in the sales value of North India in 2008-09 over the sales value of 2007-08?

- Knowing which question from a set to quit
Some questions in a set are very calculative and time consuming which alone takes almost 4-5 minutes. The candidates might be able to solve the remaining 3-4 questions in 5 minutes. So, candidates are suggested to leave that question at that particular time, and complete the remaining 4 questions and move to the next set. If you have time then in the last you can answer for that question.